WE SIMPLIFY THE COMPLEXITY OF MAINTAINING JAVA CODE


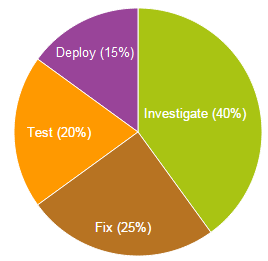
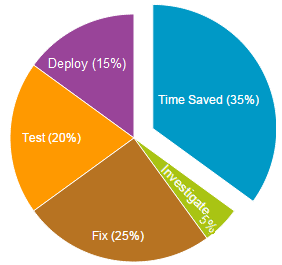
Investigating a defect usually takes 40% of the total effort spent on bug fixing. With MaintainJ, you need only 5% of the effort (2 hours instead of 2 days). MaintainJ does this by enabling you to quickly find the method or JSP or SQL where the bug exists. Once you identify where the bug is, it is easy to fix.
Watch the demo to see how you can debug a complex 8000 class Java application in just 2 minutes.
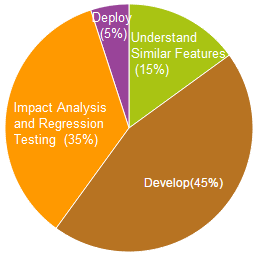
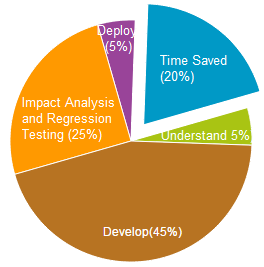
Most enhancements involve adding new features. The design for a new feature would often be similar to the design of an existing feature. Once we understand the existing feature, a new feature could easily be built by imitating the existing feature.
MaintainJ helps you to quickly understand the existing features, thereby enabling you to build new features much quicker.
Other enhancements would involve enhancing existing components. Using MaintainJ, you can quickly find the components to enhance.
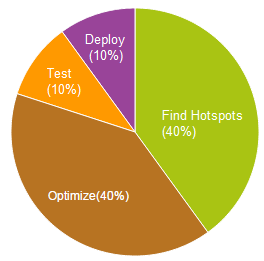
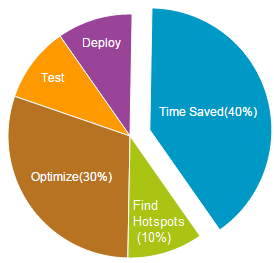
The first task of tuning is to locate the hotspots. The second task is to find ways to optimize them. Other tuning tools may be good with the first task, but they don't provide insights into how the use case works at runtime. MaintainJ helps you to do both.
Besides identifying the hotspots like methods that take long time, MaintainJ can also identify the method calls that are called repeatedly to retrieve the same data from database. By caching the data returned by these methods, you could reduce the response time of a use case.
Watch the demo to see how you can find the hotspots and candidate methods for caching in an 8000 class Java application in just 2 minutes.
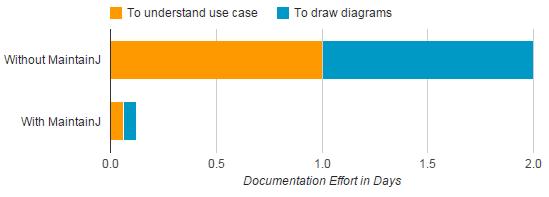
To document a use case, first you need to understand the use case and then draw the diagrams. MaintainJ combines these two steps. If you normally take 2 days to document a complex use case, now you can do it in just 1 hour.
MaintainJ generates the class and sequence diagrams at runtime while you run a use case. Hence, the generated diagrams represent the truth, not your understanding of the truth. MaintainJ's diagrams show response time of each call, the runtime parameter data and runtime SQL statements.
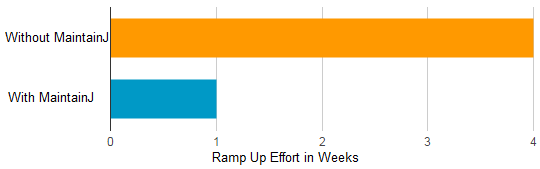
Most developers take up to 4 weeks before they start delivering on large new Java applications. This time is spent in understanding the design, many Java frameworks used in the application, some of which may be unfamiliar to the developer.
Using MaintainJ's runtime analysis features, new developers can start fixing the defects and performing minor enhancements in the first week itself, regardless of the developer's familiarity with the design, frameworks used and the size or complexity of the application.
The detailed installation instructions can be found at user guide. Below are the instructions for a quick start.
To verify the installation, create a 'MaintainJ Trace Files Project' in Eclipse by following File-->New-->Project-->MaintainJ-->MaintainJ Trace Files Project. Open the sample trace file Alfresco_Login.ser in the project to see sequence and class diagrams. You may use this sample trace file to try out the various features of MaintainJ.
To fully experience MaintainJ on your application, please get the evaluation license. You will receive an email with the license installation instructions.
Demos to generate MaintainJ trace files for different types of applications can be found here.
Below wizard helps you to a quick start.
What is the type of your application?
Web App Core Java App JUnit Applet None of these